- ¥171bn
- ¥149bn
- ¥55bn
Growth & Value
| 12m Forecast Rolling | Industry | Market | |
|---|---|---|---|
| PE Ratio (f) | 17.11 | ||
| PEG Ratio (f) | n/a | ||
| EPS Growth (f) | -0.9% | ||
| Dividend Yield (f) | 1.46% | ||
| Valuation (ttm) | Industry | Market | |
|---|---|---|---|
| Price to Book Value | 2 | ||
| Price to Tang. Book | 2.08 | ||
| Price to Free Cashflow | 20.55 | ||
| Price to Sales | 3.16 | ||
| EV to EBITDA | 11.45 | ||
Shareholder Activity
| Type | Buy / Hold / Sell |
|---|---|
| Institutions | |
| Directors | |
| Community |
Guru Screens
Quality
| Name | Industry | Market | |
|---|---|---|---|
| Return on Capital | 12.17% | ||
| Return on Equity | 10.43% | ||
| Operating Margin | 20.32% | ||
Financial Summary
| Year End 31st Mar | Unit | 2022 | 2023 | 2024 | 2025 | 2026 | 2027E | 2028E | CAGR / Avg |
|---|---|---|---|---|---|---|---|---|---|
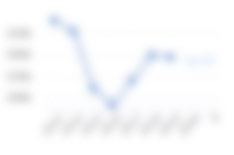
| Total Revenue | ¥m | 37,363.95 | 45,004.81 | 45,581.36 | 49,038.95 | 55,212.23 | 60,360 | 62,395 | 11.38% |
| Operating Profit | m | ||||||||
| Net Profit | m | ||||||||
| EPS Reported | |||||||||
| Diluted Normalised EPS | |||||||||
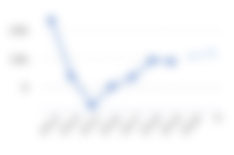
| EPS Growth | % | +21.67 | +49.78 | -8.49 | -2.27 | +26.24 | -2.91 | +11.35 | n/a |
| PE Ratio | x | ||||||||
| PEG | |||||||||
| Profitability | |||||||||
| Operating Margin | % | ||||||||
| ROA | % | ||||||||
| ROCE | % | ||||||||
| ROE | % | ||||||||
| Cashflow | |||||||||
| Op. Cashflow ps | |||||||||
| Capex ps | |||||||||
| Free Cashflow ps | |||||||||
| Dividends | |||||||||
| Dividend ps | |||||||||
| Dividend Growth | % | ||||||||
| Dividend Yield | % | ||||||||
| Dividend Cover | x | ||||||||
| Balance Sheet | |||||||||
| Cash etc | m | ||||||||
| Working Capital | m | ||||||||
| NFA | m | ||||||||
| Net Debt | m | ||||||||
| Book Value | m | ||||||||
| Diluted Weighted Average Shares | m | ||||||||
| Book Value ps | |||||||||
Other Ratios
| Leverage (ttm) | Total | - Intang | + Pension |
|---|---|---|---|
| Gross Gearing | |||
| Net Gearing | |||
| Cash / Assets |
| Liquidity (ttm) | |
|---|---|
| Curr. Ratio | |
| Quick Ratio | |
| Interest Cov. | |
| Efficiency (ttm) | |
|---|---|
| Asset Turnover | |
| Recs Turnover | |
| Stock Turnover | |
Recent History
| Latest interim period vs. prior period | Industry | Market | |
|---|---|---|---|
| Sales Growth | |||
| EPS Growth | |||
| 3yr Compound Annual Growth Rate | Industry | Market | |
|---|---|---|---|
| Sales CAGR | |||
| EPS CAGR | |||
| DPS CAGR | |||



Profile Summary
Riken Keiki Co Ltd is a Japan-based company mainly engaged in the manufacture and sale of various industrial measuring instruments, as well as related business activities. It manufactures and sells gas detection and alarm equipment and provides after-sales maintenance services related to the equipment. Its products include portable gas detectors, fixed gas detectors, and other measuring instruments. Portable gas detectors include multi-gas detectors and single-component gas detectors. Fixed gas detectors include detectors, alarms, analyzers, and other components. It also offers analytical instruments, including atmospheric photoelectron yield spectroscopy instruments and portable multi-X-ray analyzers. Its industrial gas detectors are used in places where gas is likely to be generated and in industries that use gas, including semiconductor manufacturing, oil refining, steelmaking, power generation, city gas, waterworks and sewerage, food manufacturing, and others.
Directors
- Hisayoshi Kobayashi CHM (66)
- Junichi Koyano PRE (63)
- Shinya Kobu MEO (61)
- Tetsuya Matsumoto MEO (57)
- Koji Inoue DSL
- Masaaki Kojima DSL
- Shoji Kizaki EXO (59)
- Shinichi Adachi EXO
- Sumihisa Ishihara EXO
- Tetsuya Kawabe EXO
- Kazuma Nakamura EXO
- Shuji Tajima EXO
- Nobuo Nakano DRC (68)
- Takehito Miyaguchi IND (65)
- Michimasa Taga IND (68)
- Yasuko Uematsu IND (44)
- Last Annual
- March 31st, 2026
- Last Interim
- December 31st, 2025
- Incorporated
- July 30th, 1934
- Public Since
- October 2nd, 1961
- No. of Employees
- 1,407
- Sector
- Machinery, Equipment & Components
- Industry
- Industrials
- Exchange
 Tokyo Stock Exchange
- Shares in Issue
- 45,455,784

- Address
- 2-7-6, Azusawa, ITABASHI-KU, 174-8744
- Web
- https://www.rikenkeiki.co.jp/
- Phone
- +81 339661121
- Auditors
- Deloitte Touche Tohmatsu LLC
Upcoming Events for 7734
Dividend For 7734.T - 30.0000 JPY
Similar to 7734
A&D Holon Holdings Co
Tokyo Stock Exchange
Advanex
Tokyo Stock Exchange
Aichi
Tokyo Stock Exchange
Aichi Tokei Denki Co
Tokyo Stock Exchange
Aida Engineering
Tokyo Stock Exchange
FAQ
What is the Riken Keiki Co share price?
As of Today at 22:57 UTC, shares in Riken Keiki Co are trading at ¥3,755. This share price information is delayed by 15 minutes.
How has the Riken Keiki Co share price performed this year?
Shares in Riken Keiki Co last closed at ¥3,755 and the price had moved by +39.38% over the past 365 days. In terms of relative price strength the Riken Keiki Co share price has underperformed the Nikkei 225 Index by -18.61% over the past year.
What are the analyst and broker recommendations for Riken Keiki Co?
The overall consensus recommendation for Riken Keiki Co is Hold. You can view the full broker recommendation list by unlocking its StockReport.
Find out moreWhat is the Riken Keiki Co dividend yield?
The Riken Keiki Co dividend yield is 1.33% based on the trailing twelve month period.
Does Riken Keiki Co pay a dividend?
Last year, Riken Keiki Co paid a total dividend of ¥50, and it currently has a trailing dividend yield of 1.33%.Looking ahead, the next dividend pay date is 2026-06-04.
When does Riken Keiki Co next pay dividends?
We do not have data on when Riken Keiki Co is to next pay dividends. The historic dividend yield on Riken Keiki Co shares is currently 1.33%.
How do I buy Riken Keiki Co shares?
To buy shares in Riken Keiki Co you'll need a share-dealing account with an online or offline stock broker. Once you have opened your account and transferred funds into it, you'll be able to search and select shares to buy and sell. You can use Stockopedia’s share research software to help you find the the kinds of shares that suit your investment strategy and objectives.
What is the market cap of Riken Keiki Co?
As of the previous close price of ¥3,755, shares in Riken Keiki Co had a market capitalisation of ¥171bn.
Where are Riken Keiki Co shares listed?
Here are the trading details for Riken Keiki Co:
- Country of listing: Japan
- Exchange: TYO
- Ticker Symbol: 7734
What kind of share is Riken Keiki Co?
Based on an overall assessment of its quality, value and momentum Riken Keiki Co is currently classified as a High Flyer. The classification is based on a composite score that examines a wide range of fundamental and technical measures. Stock are classified on the the following spectrum: Super Stocks, High Flyers, Contrarians, Turnarounds, Neutral, Value Traps, Momentum Traps, Falling Stars, and Sucker Stocks. For more information, learn about our StockRank Styles.
Is there a Riken Keiki Co share price forecast for 2026?
The analyst consensus target price for shares in Riken Keiki Co is ¥4,500. That is 19.84% above the last closing price of ¥3,755.
Analysts covering Riken Keiki Co currently have a consensus Earnings Per Share (EPS) forecast of ¥216 for the next financial year.
Find out moreWhat is the trend in the Riken Keiki Co share price?
An important predictor of whether a stock price will go up is its track record of momentum. Price trends tend to persist, so it's worth looking at them when it comes to a share like Riken Keiki Co. Over the past six months, its share price has underperformed the Nikkei 225 Index by -6.19%.
As of the last closing price of ¥3,755, shares in Riken Keiki Co were trading +13.47% higher than their 200 day moving average. You can read more about the power of momentum in assessing share price movements on Stockopedia.
What is the Riken Keiki Co PE Ratio?
The Riken Keiki Co PE ratio based on its reported earnings over the past 12 months is 17.11. The shares last closed at ¥3,755.
The PE ratio (or price-to-earnings ratio) is the one of the most popular valuation measures used by stock market investors. It is calculated by dividing a company's price per share by its earnings per share.
The PE ratio can be seen as being expressed in years, in the sense that it shows the number of years of earnings which would be required to pay back the purchase price, ignoring inflation. So in general terms, the higher the PE, the more expensive the stock is.
Who are the key directors of Riken Keiki Co?
Riken Keiki Co's management team is headed by:
- Hisayoshi Kobayashi - CHM
- Junichi Koyano - PRE
- Shinya Kobu - MEO
- Tetsuya Matsumoto - MEO
- Koji Inoue - DSL
- Masaaki Kojima - DSL
- Shoji Kizaki - EXO
- Shinichi Adachi - EXO
- Sumihisa Ishihara - EXO
- Tetsuya Kawabe - EXO
- Kazuma Nakamura - EXO
- Shuji Tajima - EXO
- Nobuo Nakano - DRC
- Takehito Miyaguchi - IND
- Michimasa Taga - IND
- Yasuko Uematsu - IND